Category: Blogs

Illustration of a thoughtful man with arrows and gears in the background, showing text 5-Point vs 7-Point Likert Scale on a blue gradient background.
5-Point vs 7-Point Likert Scale

5-Point vs 7-Point Likert Scale – Key Differences Explained

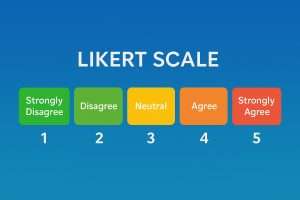
Surveys are strong tools to gather opinions, acquire measurements in attitudes, and to analyse behaviour. Likert scale is probably the most popular in the center of most surveys, which is a rating technique that introduces evaluations and as a result provides them as measurable facts. A typical decision one has

Read More »
Illustration of people analyzing data with charts and graphs in blue-themed office setting, with text One-Way vs Two-Way ANOVA on bluish gradient background.
One-Way vs Two-Way ANOVA

One-Way vs Two-Way ANOVA: Definitions, Differences, Use

Modern research is based on statistical analysis. In the areas of medicine, psychology, education, agriculture, or business, researchers may have the interest of comparing the performance of two groups. However, a series of t-tests to compare group means may easily inflate the probability of false positives. Here is where One-Way

Read More »
Two-way ANOVA diagram with Factor A and Factor B levels in a 2x2 grid, blue gradient background, showing effect on dependent variable.
Two-Way ANOVA

When and How to Use Two-Way ANOVA (With Real-Life Examples)

ANOVA is a fundamental technique in statistics and, although the one-way ANOVA is very useful to compare three or more groups on the basis of one factor, research questions are usually more intricate. This is where the two-way ANOVA comes to the fore. The two-way ANOVA enables you to analyse

Read More »
Professional flat-style illustration of One-Way ANOVA concept with white human icons and red shapes representing independent variables on a bluish gradient background.
One-Way ANOVA

Understanding One-Way ANOVA | Step-by-Step Guide with Examples

One way analysis of variance (usually called one-way ANOVA) is one of the most popular methods of analysis in research and applied areas. When you want to compare the means of three or more independent groups, here is the tool that provides you with a reliable answer without the danger

Read More »
A Likert scale graphic with a bluish gradient background, showing response options from strongly disagree to strongly agree.
Likert Scale

Likert Scale in Research: Best Practices & Real Examples

In research world, intensity of human attitudes, perceptions and opinions are of utmost importance. Getting beyond the yes/no questions allows the researcher to glimpse the gray scale of human life. This is where the Likert scale comes in as a very useful instrument. Likert scale was created in 1932 by

Read More »
Illustration of purposive sampling showing a blue figure selecting specific individuals from a group using red arrows.
Purposive Sampling

Purposive Sampling: A Complete Guide with Definition, Types, and Examples

In the study, choosing the right candidates can either succeed or ruin your study. Although random sampling has been viewed as the gold standard, it is a fact that in most instances researchers would require a narrower sampling technique. Enter the idea of purposive sampling- a strong non-probability purposive sample

Read More »
Illustration showing non-probability sampling methods with icons and charts on a blue gradient background for research concepts.
non-probability sampling

What Is Non-Probability Sampling? | Types & Examples

Sampling in research is extremely important to define the reliability and accuracy of findings. The probability sampling makes sure that each member of the population has a known probability of being sampled as non-probability sampling techniques do not offer this consideration. Rather, non-probability sampling will be used where the subjects

Read More »
Infographic showing probability sampling with a group of people selected through a magnifying glass on a blue gradient background.
Probability Sampling

Probability Sampling: Types and Key Examples Explained

Probability sampling in research is any method of sampling in which each member of a population has a known, discrete non-zero probability of selection into the sample. This is one of the core techniques of statistical sampling since it enables the researcher to draw statistical conclusions about a given population

Read More »
Illustration of a cover letter document with a fountain pen on a bluish background, symbolizing job application and professionalism.
Cover Letter

The Ultimate Guide to Writing a Powerful Cover Letter

A cover letter might appear an intimidating task to undertake yet it is a very important aspect of your job application. A good cover letter is going to attract the employer to see you as someone different from all the other applicants, and provide you with a platform to convince

Read More »
The image shows a guide on essay length with a title How Long Should an Essay Be? Complete Length Guide and includes illustrations of people working.
How Long Should an Essay Be

How Long Should an Essay Be? Guidelines for Different Essay Types

So, this is just one of the many things students and writers find difficult to determine an essay’s suitable length. There are different types of essays writings, and each is meant for a definite purpose; the length required may vary depending on the type of essay, the audience, and the

Read More »