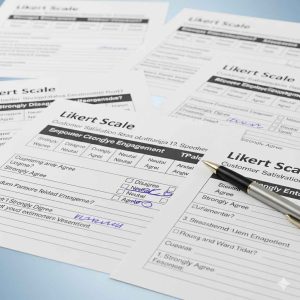
Likert scales vs semantic Differential Scale: Key Differences Explained

Likert scales vs semantic differential Understand the key differences and when to use each for effective survey design and data collection.

The decision about the response format of the survey is one of the crucial decisions to make when the survey is planned. The quality of the data and the insights you can derive may be based on the way the questions are written as well as how responses are recorded. The Likert scale vs semantic […]

Best Practices for Creating Likert Scale Questionnaires

Printed Likert scale questionnaires with checkboxes and handwritten answers, used for customer satisfaction and feedback surveys.

One of the most effective tools to get to know the level of customer satisfaction, employee engagement, or academic research results is survey. Central to most good surveys is the Likert scale, a mere-but-effective way to gauge opinions, attitudes and perceptions. Properly applied, Likert scales can give useful information that enables making data-based organizational decisions. […]

5-Point vs 7-Point Likert Scale – Key Differences Explained

Illustration of a thoughtful man with arrows and gears in the background, showing text 5-Point vs 7-Point Likert Scale on a blue gradient background.

Surveys are strong tools to gather opinions, acquire measurements in attitudes, and to analyse behaviour. Likert scale is probably the most popular in the center of most surveys, which is a rating technique that introduces evaluations and as a result provides them as measurable facts. A typical decision one has to make in design is […]

One-Way vs Two-Way ANOVA: Definitions, Differences, Use

Illustration of people analyzing data with charts and graphs in blue-themed office setting, with text One-Way vs Two-Way ANOVA on bluish gradient background.

Modern research is based on statistical analysis. In the areas of medicine, psychology, education, agriculture, or business, researchers may have the interest of comparing the performance of two groups. However, a series of t-tests to compare group means may easily inflate the probability of false positives. Here is where One-Way vs Two-Way ANOVA  (Analysis of […]

When and How to Use Two-Way ANOVA (With Real-Life Examples)

Two-way ANOVA diagram with Factor A and Factor B levels in a 2x2 grid, blue gradient background, showing effect on dependent variable.

ANOVA is a fundamental technique in statistics and, although the one-way ANOVA is very useful to compare three or more groups on the basis of one factor, research questions are usually more intricate. This is where the two-way ANOVA comes to the fore. The two-way ANOVA enables you to analyse the impact of two independent […]

Understanding One-Way ANOVA | Step-by-Step Guide with Examples

Professional flat-style illustration of One-Way ANOVA concept with white human icons and red shapes representing independent variables on a bluish gradient background.

One way analysis of variance (usually called one-way ANOVA) is one of the most popular methods of analysis in research and applied areas. When you want to compare the means of three or more independent groups, here is the tool that provides you with a reliable answer without the danger of inflating false positives that […]